Storytelling is essential to effective communication. Stories have the power to drive emotions, initiate meaningful connections, and relate to an audience. I, too, am a storyteller — the only difference is that my stories originate from data. In this article, I'll share my approach to using social media data to extract the most meaningful insights for connecting with your audience.
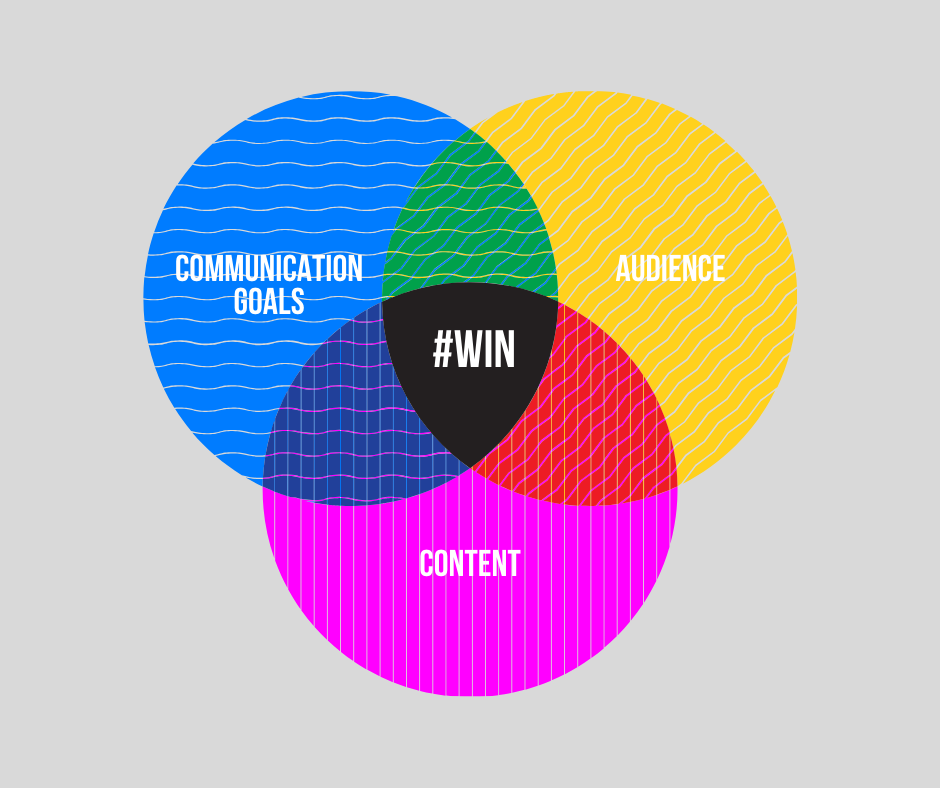
Through my research and work experience in the field of social media, I have learned that success comes down to an alignment between communication goals, audience and content. A fine-tuned alignment between these three elements can drive communication work to achieve its highest potential. For example, content anchored in communication goals but not aligned with audience preferences will not yield the desired engagement. On the other hand, great content that resonates well with the target audience could result in great engagement — but if that content is not rooted in communication goals, it does not serve the organization in the best possible way. A well-balanced approach among these three elements is where success lies.

Communication goals: Your purpose
The field of social media has been the focus of most of my research projects. Working with large data sets could get quite overwhelming; the only way I am able to navigate my way through social media data is to have a clear understanding of my research objectives. Research objectives drive my approach to collecting and analyzing data, and identifying the implications of that data.
Achieving communication goals is the end game: what we are trying to accomplish with our communication efforts. In my role as a social media and web specialist, I have used corporate communication goals to drive S.M.A.R.T (Specific, Measurable, Attainable, Realistic, and Timely) goals for social media strategy.
Communication goals, like research objectives, are foundational when it comes to social media performance metrics tracking and analysis. For example, for a communication goal of increasing brand awareness, the most suitable performance metrics would be follower growth, reach/impression, engagement (direct and indirect), mentions, etc. On the other hand, if you have a communication goal that includes an action item (click a link, donate, etc.), then it makes sense to pay attention to metrics such as link clicks. Furthermore, if your corporate website is an integral part of achieving your communication goals, then it makes sense to include your website analytics as well.
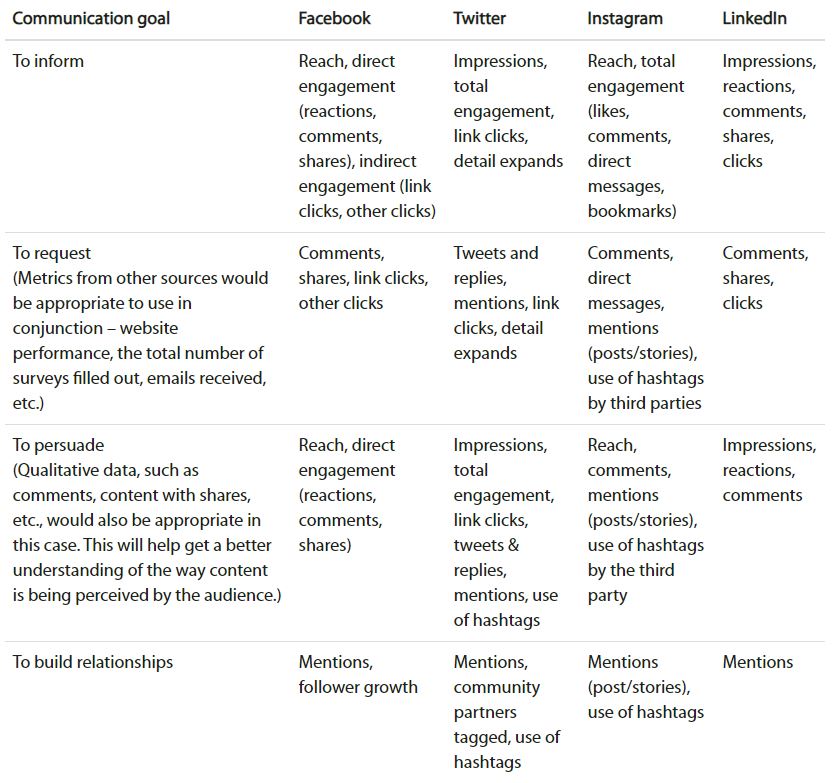
Here is a quick list of performance metrics best suited for some of the most common communication goals:

Each performance metric listed above serves one of the two dimensions when it comes to extracting stories out of data: reach or engagement. The dynamic between reach and engagement is sort of a chicken-and-egg situation: We need a certain level of engagement to attain a certain level of reach, and vice versa. That said, the basic reach and engagement numbers help paint an overall picture and should be tracked together whether it "fits" your communication goals or not. It is also a good idea to have an understanding of what each performance metric stands for. Once you figure out a list of performance metrics that suit best your communication goals, you are ready to collect your social media data.
Audience: Starting with the end in the mind
In less than two decades, social networking services have made a significant impact on the world that we live in. They impact the way we consume and disseminate information, the way we connect with each other, and above all, the way we express ourselves.Social media users engage with content that they either relate to or oppose. The motivation, positive or negative, behind someone's decision to create or engage with content cannot be overlooked. Why? If your content does not align with your audience's values, expectations, or ideas about self-expression, they are going to scroll right past your social media post.
Consider this: Think of the last time you positively or negatively engaged with a corporate social media post or a sponsored advertisement. What was your motivation? Was it because you liked the fact that an organization paid money to introduce themselves in your timeline? Or was it because the product/service/information added value to your experience, stirred up emotions, sparked an idea, or simply aligned with (or opposed) your values? I bet it was one of the latter reasons.
The good news is that pretty much every social media platform provides an in-depth audience insight. If you are considering tracking performance metrics on a regular basis, get an understanding of your audience first. Audience insights, specific to your social media platform, enable communication professionals to curate content in tone, language and visuals that best resonate with your followers.Here are some of the points that I would recommend considering when looking at audience insights:
- Identify the most popular follower groups based on demographics, such as gender, age, region, interests, etc.
- Ask yourself: Is the most popular follower group close to the target audience you intend to reach?
- Create audience profiles based on audience insights. Audience profiles could be as detailed as you want them to be. Some of the details could include name, occupation, family status, interests, etc. The important point here is to make the profiles as realistic as possible. Audience profiles are a great way to inspire content authors to write as if they are speaking to a specific person, rather than writing for an abstract idea of a follower base.
- Find out what your follower base is most interested in. For example, if your audience base consists mostly of women between the ages of 35 and 45, then research what kind of content this group engages with the most.
Audience insights also help bring context to performance metrics discussed in the previous section. For example, if your communication goal is to inform and if you are not seeing the reach as expected or desired, then the audience insights may provide further context. You may identify a gap between your follower base and the audience you desire to reach or you may need to adjust your tone because your follower base prefers a certain tone.
Content: The star
Content is truly the star of any social media strategy. Intentional content, curated especially for your audience and rooted in your "why" can achieve desired outcomes. Content creation is more art than science. Of course, there are ways to incorporate tactics, but engaging content requires some creativity.When it comes to mapping out content with performance metrics, I rely on some techniques that I typically use for my research:
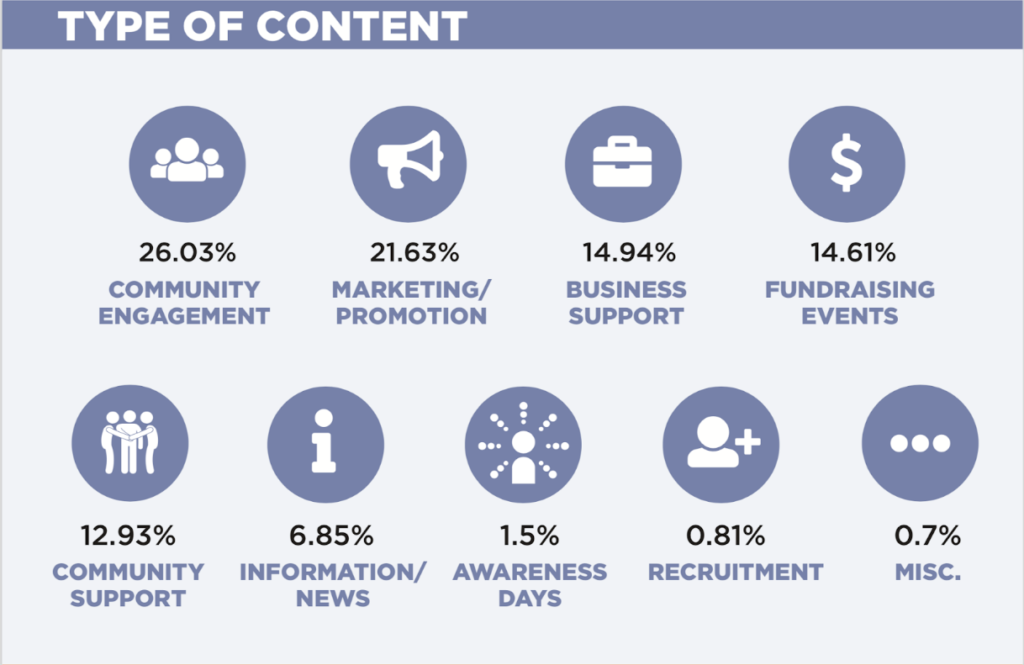
Categorization: When working with data, i'ts' helpful to categorize a piece of content. For example, the infographic below shows the categories that I used for my last paper. This technique helps you understand what type of content is being posted the most. This type of data facilitates meaningful discussions on creating more intentional content.

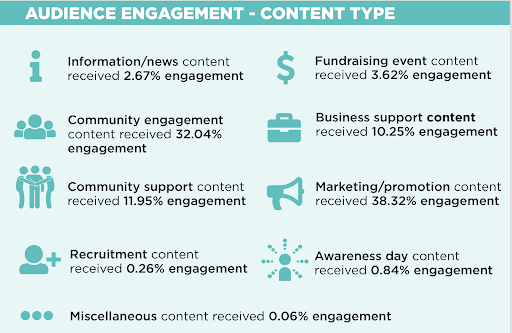
Audience engagement: Categorization also helps to identify the content types that are most or least popular with the audience. Here is another example of my research project: this infographic depicts the audience engagement with respective content types. Implications from this type of analysis allow professionals to have discussions on adjusting tactics on communicating certain content types that may or may not be that popular.

For example, a particular content type might be a corporate priority, but might get the least engagement. In this case, the conclusions from this analysis would be quite meaningful in adjusting your approach.The content itself is the only one way to connect with an audience. Social media users are far more savvy than ever and expect more out of the brands they see in their timelines. Inauthentic content simply does not belong in this day and age of social media.
Performance metrics at Health Sciences North
At Health Sciences North, we track and analyze each social media post. We use a SharePoint-based system to maintain an editorial calendar and to collect performance metrics data. In my role, I collect, analyze, and create reports for the communication team and other teams across the organization.
Weekly reports: We produce a weekly report every week with results of social media posts posted over the prior week. These reports are a quick performance-check that enables us to make any quick adjustments on content in the near future. Since the content is fresh in all our memories, we take this opportunity to see if we were off or on the mark. The reports are the bare minimum, only indicating key performance metrics and whether a post was "green" (above performance threshold) or "red" (below performance threshold).
Quarterly reports: A quarterly report is more in-depth and this where there is the greatest opportunity for storytelling. Quarterly reports offer a big enough data set to identify patterns and draw meaningful conclusions. Following are some of the points that I focus on:
- Tying the content back to Health Services North's strategic key goals: As a team, we look at which key goals we talked about the most and the least. We also take a look at the distribution of "green/red" status across the key goals. This set of implications allows us to take a look at some of the priorities that may not be getting as much attention as they should be and to adjust our approach.
- Content type and engagement: We then also take a look at a pattern of content type posted on all our social media channels, along with their "green/red" status. I first look for the performance of a particular content type on a particular social media platform. I also look for a basic breakdown of content types we've created content for over a period of time. Conclusions from this analysis help us make adjustments to our approach, especially for the content types that are not resonating with our target audience.
- Social media platforms: Last, but not the least, we take a deeper dive into our individual social media platform performance. In this part, we talk about follower growth, total audience reach, mentions, etc. Inferences from this analysis are mostly used for adjusting our tactics for a particular social media platform.
Suchita BaliSuchita Bali is a social media and web specialist at Health Sciences North and a Ph.D. student at Laurentian University. Her love for social media and numbers propelled her career in the digital communication field. She believes in taking a storytelling approach when working with analytics and research. Her day job includes managing social media and web platforms for the largest academic teaching hospital in Northeastern Ontario, Canada. In her role at the hospital, she has written the digital communication strategy, including a social media and web content management strategy. Through her Ph.D., she aspires to explore and discover some of the biggest constraints faced by Canadian healthcare foundations in the digital space.