The term “end-user privacy” refers to protecting digital profiles on various social networking services, such as Facebook, Twitter, Instagram or Google. All social media platforms offer privacy and security features that give end users control over their account and personal data. This concept is not new, but it has certainly gained some serious attention over the past couple of years.
In 2018, the Cambridge Analytica case brought much-needed attention to end-user privacy. This case was the epitome of the power of user data, demonstrating that user data can challenge a presumptuous concept like democracy. After this case, there was an increased awareness among social media platform users. Social networking organizations, like Facebook Inc. and Twitter, have since introduced new privacy and security features to make users feel secure and in control of their personal data. End users have far more say in who and what they want to see in their news feeds.
So why do we need to worry about this shift? In short, it has had a direct impact on the way an audience interacts with social media content, which further impacts an organization’s performance metrics. This article presents a data-driven social media strategy that uses customization to navigate the ever-changing landscape of the social media world.
A Primer on Social Media Privacy and Security Settings
Before an organization can devise a social media plan that adapts to the shifting landscape of user privacy, one must first understand each platform’s unique capabilities.
The privacy and security settings in the chart below greatly influence reach and impressions, direct and indirect engagement from current and future followers, word-of-mouth promotion and networking capabilities. These factors all have a direct impact on social media performance by any organization.
| |
Privacy and Security Settings |
| Facebook |
- Content creation/sharing: Public vs. private with the exclusion of a list of specific users
- Content consumption: Hide posts, hide all posts, unfollow a user or page, granular control over sponsored content
- Networking: Control over tagging
|
| Twitter |
- Content creation/sharing: Public vs. private accounts
- Content consumption: Block or mute accounts, set preferences on various industries and topics, granular control over sponsored content
- Networking: Control over tagging
|
| Instagram |
- Content creation/sharing: Public vs. private accounts vs. close friends (a subset of followers)
- Content consumption: Restricted, unfollow or mute accounts, granular control over sponsored content, granular control over comments from other users
- Networking: Control over tagging, mentions, “total number of likes†on third party posts not available
|
| LinkedIn |
- Content creation/sharing: Public vs. public and Twitter vs. connections only vs. a selected group member.
- Content consumption: Hide a post, unfollow a user, ability to set preferences to improve the feed, block accounts
- Networking: Control over mentions and tags from others
|
Data-Driven Social Media Strategy: A Customized Approach
Health Sciences North (HSN) is the largest academic teaching hospital in the region of Northeastern Ontario, Canada. Health care in Canada is provincially funded, which means that the hospitals have no monetary goals on social media; fundraising and donor attraction/retention are led by designated hospital foundations. Therefore, SMART (Specific, Measurable, Attainable, Relevant, Time-Bound) social media goals for HSN are purely around brand awareness and public relations. The following image presents a snapshot of HSN’s social media strategy:
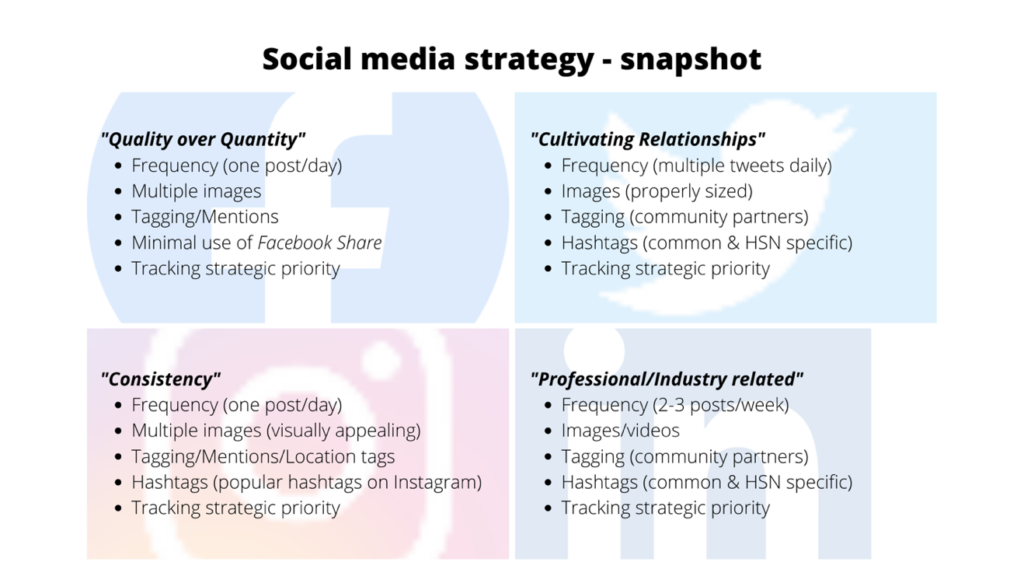
There are three levels of customization within the social media strategy that keep the approach flexible enough to quickly adjust to all shifts happening in the social media world. (Data presented in this article is from the period of May 2019 to February 2020.) Treemaps are used throughout this article to demonstrate the expansive data. Treemaps are an effective way to display the distribution of data across hierarchical categories.
Level One: Aligning Content With Target Audience Interests
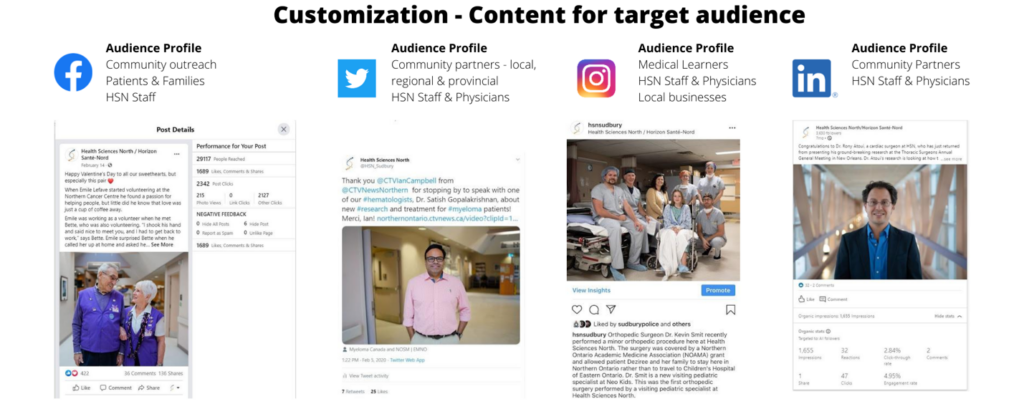
The first level is to curate customized content for the target audience. Having a better understanding of the target audience is key — it’s like starting with the end in mind. The image below provides a quick summary of the target audience on Facebook, Twitter, Instagram and LinkedIn, and four examples of high-performing posts from four different channels, each of which aligned with audience profiles.
The first example is a Valentine’s Day post about a couple who met while volunteering at HSN (a feel-good story). The second is about one of HSN’s hematologists who was published in a reputable journal (engaged with multiple community partners on this post). The third post is about a procedure done for the first time in Northeastern Ontario featuring a patient and the care team (good engagement from medical learners and local businesses). The last post is about one of our cardiac surgeons at HSN, who had presented his work at an international conference (this post was industry-related, therefore, got a good engagement from the community partners and HSN staff). This representation demonstrates distinctive expectations from the different target audiences.
Following the Data to Inform Content Decisions
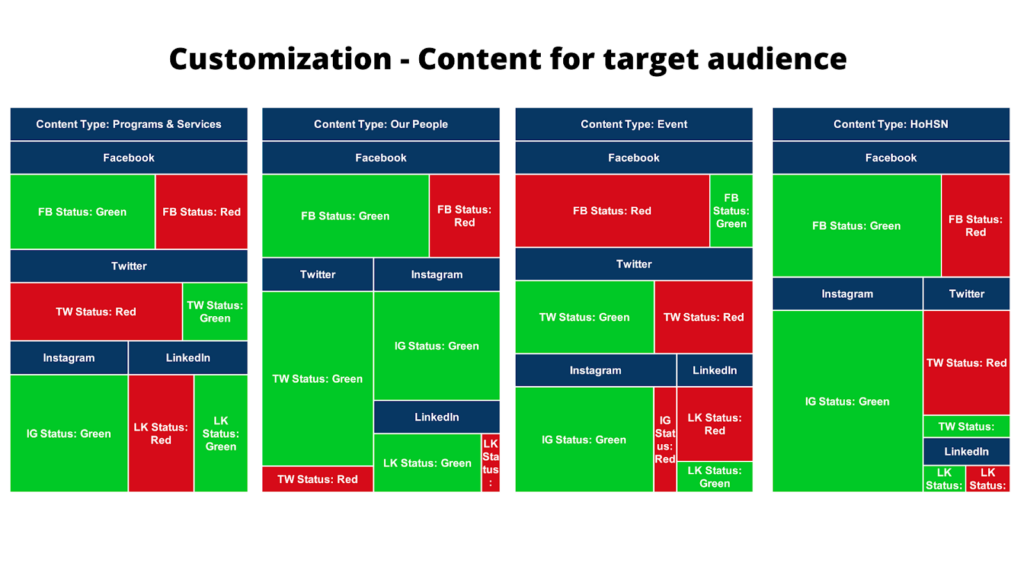
The following treemap shows four content-type categories — “Programs & Services,” “Our People,” “Event” and “Humans of HSN.” For each content-type category, the treemap displays the distribution of content posted on each social media platform, which is further divided by a performance status — green or red. The green and red statuses displayed below are based on performance metrics targets set for each social media platform. The bigger the rectangle, the more of data representation for a particular category. For example, for Content Type: Programs & Services, Facebook has more “green” content than Twitter, Instagram performance was always above par and lastly, LinkedIn had almost same ratio for green and red content.
This data paints a good picture of how different target audiences interact with different types of content pieces. For example, “Programs & Services” and “Humans of HSN” features work well on Facebook and Instagram, but not as much when it comes to Twitter. On the other hand, “Events” does well on Twitter but not on Facebook and Instagram.
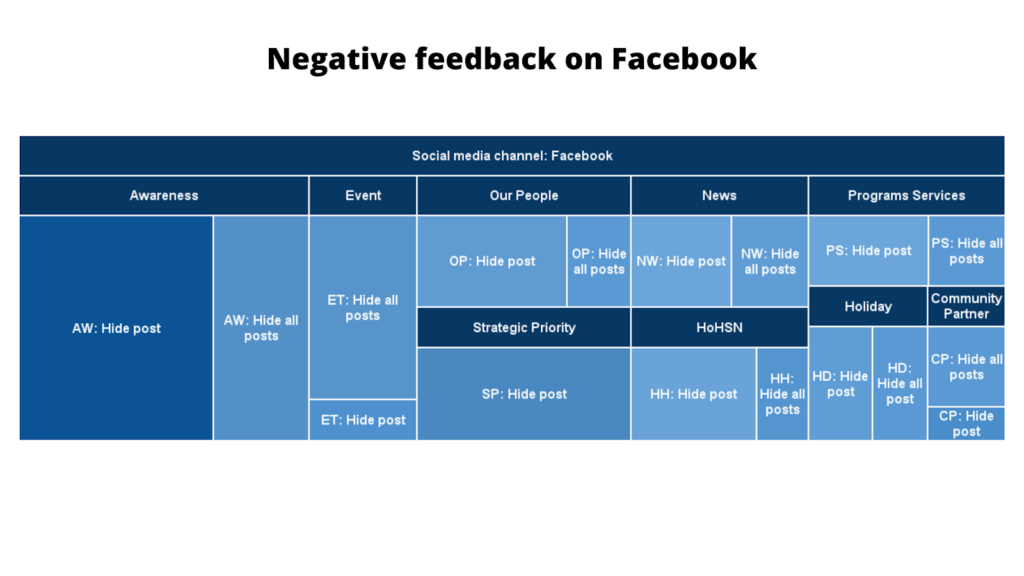
Negative feedback data from Facebook further complements these insights. The treemap below represents the “hide posts” and “hide all posts” data on the HSN Facebook page.
This treemap includes all content types with a breakdown of negative feedback for the corresponding type of content. For example, Awareness content received the most amount of negative feedback, with AW: Hide post greater than AW: Hide all posts. It can be further noticed that Event and Community Partner (shared content) posts get the greatest amount of “hide all posts” numbers. This implication is crucial for making future content decisions — such as tone, approach, story, etc. — for content types that are not resonating well with the target audience.
Level Two: Aligning Content With the Culture of the Platform
Each social media platform has its own culture or vibe. Curating content in a way that incorporates the vibe and features of a particular social media platform is the second level of customization — the same message with a different feel. The image below demonstrates an example of an annual awareness day called “Bell Let’s Talk.”
This piece of content delivered the same message but with different tactics.
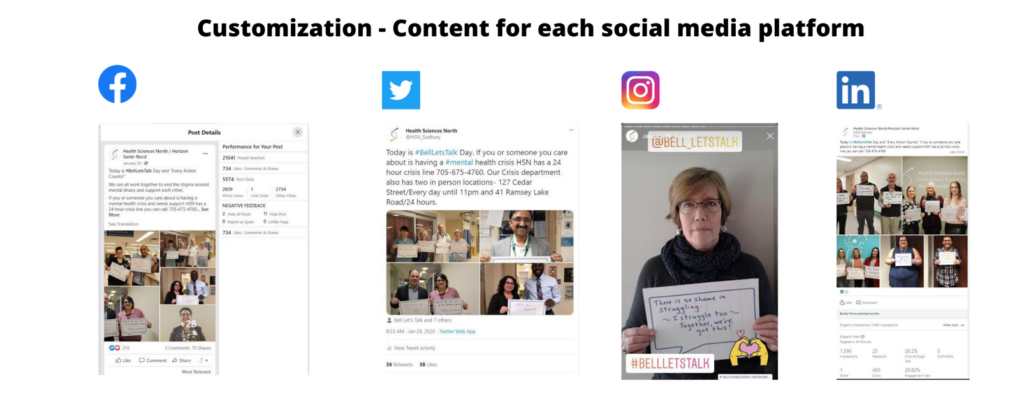
Facebook published one single post with several images. This tactic was used to conform the limit of one post per day and to use multiple pictures with a post, which tends to attract engagement from HSN audience.
Twitter broke down the same content into a series of tweets, tagging relevant community partners. This tactic complied well with our approach on Twitter to post multiple tweets in a day. Instagram used a carousel with multiple images, along with a series of stories posted throughout the day, including mentions, hashtags and GIFs. This tactic was to purely “speak” the language of the platform; stories were a great way to compliment the main carousel post on Instagram. HSN also got further exposure by getting the stories featured on Bell Let’s Talk official Instagram account.
Lastly, on LinkedIn, there were three posts in total, featuring two staff members, and a generic story with the mental health program information (shown in the image above). Out of the two, the generic post did the best, which demonstrates that LinkedIn is not the right platform for personal stories but rather more about professional or industry related content.
Level Three: Analytics and KPIs That Meet Organizational Goals
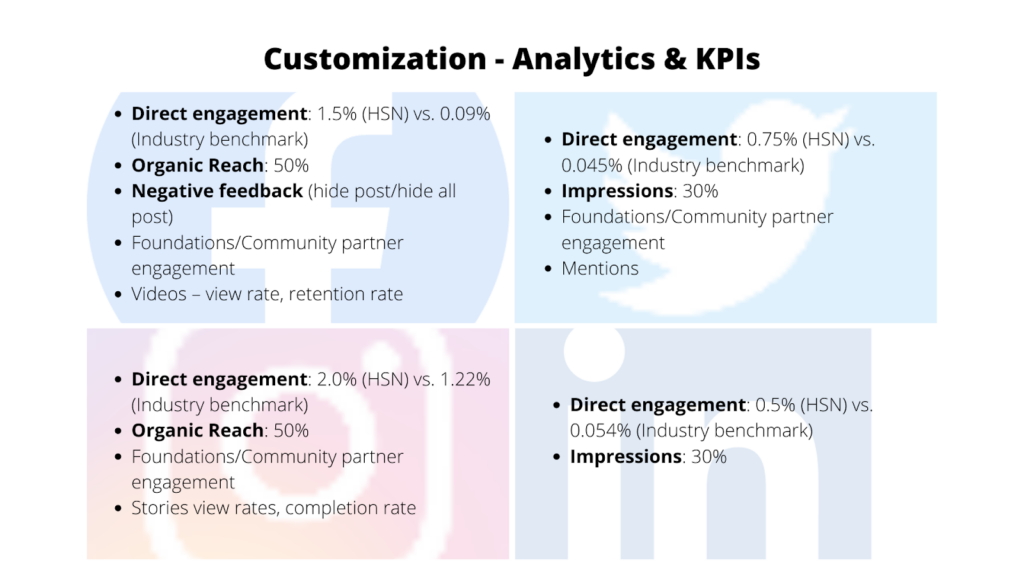
The last customization involves devising analytics and KPIs specifically for HSN channels. All social media platforms provide a comprehensive list of performance metrics for tracking and analyzing. A basic understanding of each performance metric is a crucial starting point. From that point on, it’s important to track numbers that help draw meaningful implications.
HSN’s social media strategy includes performance metrics that serve well to its SMART goals. The image below outlines the metrics tracked for various corporate channels. The target performance ratios (direct engagement and reach/impressions) are based on HSN’s past performance metrics and industry benchmarks. When setting these numbers, it is important to work with a target that is attainable (not too easy or difficult) and to keep in mind what is best for the organization. The industry benchmarks act as a guiding post and a great indicator to evaluate performance, but by no means dictate the target ratios.
HSN’s strategic priorities are important corporate metrics to track. The following treemap provides a breakdown of strategic priorities content shared on social media. It exhibits the strategic key goals that were most (bigger rectangles) and least (smaller rectangles) focused on during the period of data collected. This metric is significant, as it drives intentional conversations regarding which priorities are being discussed and which ones need more attention.

Conclusion
End-user privacy is here to stay, and in order to navigate this and any other future shifts, organizations must create authentic content that resonates with their audience, keeping them engaged and wanting to come back. As communication professionals, we must ask ourselves, “What value does a piece of content bring to a user?” Then we must communicate the why. End users have far more granular control and will not hesitate to mute, block or unfollow an organization on social media. Regular customized performance metrics go a long way to gain insights into what works and what does not.
At the 2020 Virtual World Conference, Suchita presented “End-User Privacy Is the Future: #AreYouReady?” Review this session and others by purchasing one or more of the conference recording packages. View all available recording packages here.
Suchita BaliSuchita Bali is a social media and web specialist at Health Sciences North and also a Ph.D. student at Laurentian University. Her love for social media and numbers propelled her career in the digital communication. She believes that all numbers tell a story and takes a storytelling approach when working with analytics and research. Bali’s day job includes managing social media and web platforms for the largest academic teaching hospital in Northeastern Ontario, Canada. In her role at the hospital, she has written the digital communication strategy, including a social media and web content management strategy. Through her Ph.D., Bali aspires to explore and discover some of the biggest constraints faced by Canadian health care foundations in the digital space. Her educational background includes an MBA and a bachelor’s degree in computer science and commerce.